
TL;DR — Bookmark This
If you have ever asked "are these lane rates actually good?" — you are already doing rate benchmarking. You just need a method that is consistent and data-driven. Here is the short version:
- Benchmark using bands (p25/median/p75), not a single "average rate"
- Normalize rates to apples-to-apples: same equipment, distance, linehaul vs all-in, and time window
- Use capacity + diesel context to interpret whether a quote is "high" or just "market reality"
- Use a repeatable template so your decision process does not change load-to-load
- Market Overview — current conditions
- Freight Rates & Capacity — lane comps
- Fuel Price Index — diesel tracking
- Capacity Tightness Index — tight/loose signal
- Lane Opportunities — scored lane ratings
- Profit Calculator — cost-per-mile analysis
What "Freight Rate Benchmarking" Actually Means
A freight rate benchmark is a reference point — or, ideally, a reference range — you use to judge whether a quoted rate is:
- Within market — fair for current conditions
- Above market — strong for carriers, potentially overpriced for brokers/shippers
- Below market — weak offer, or comes with hidden friction
The mistake most people make: treating the benchmark as a single number. Rates are a distribution, not a point.
Why Distributions Beat Single Numbers
Even on the "same lane," truckload freight rates vary based on:
- Pickup day/time and appointment constraints
- Deadhead, dwell, and detention risk
- Shipper/broker reputation and payment terms
- Equipment type and trailer requirements
- Seasonality and capacity conditions
So instead of chasing a single number, benchmark using a band — for example: p25 (25th percentile) / median / p75 (75th percentile).
Insight: If you only track the "average," you will often accept bad loads when the market shifts — because averages lag and hide volatility. Medians are more resistant to outliers and give you a truer center of the market.
Step-by-Step: How to Benchmark Freight Lane Rates (Under 10 Minutes)
Here is the process — and what this post's templates support.
Step 1: Define the Lane Precisely
Write it down like a machine would:
- Origin: city/state (or ZIP3 if you track it)
- Destination: city/state (or ZIP3)
- Equipment: dry van / reefer / flatbed
- Distance: loaded miles
- Date window: last 7 days vs 14 vs 30
If you do not define the lane precisely, your comps will be noisy and misleading.
Shortcut: Start with the Freight Rates & Capacity view and use the same lane definition every time.Step 2: Normalize the Rate (Linehaul vs All-In)
Decide what you are benchmarking:
- All-in RPM — includes fuel surcharge and sometimes accessorials
- Linehaul RPM — cleaner for comparisons when fuel surcharges vary
At minimum, keep these separate in your tracking template.
Insight: If diesel is moving fast, you will misread all-in comps unless you also track diesel separately. Right now diesel is at $5.35/gal nationally — check the Fuel Price Index to sanity-check changes week over week. A $0.50/gal diesel swing can move all-in RPM by $0.07-$0.10/mi without any change in actual linehaul rates.
Step 3: Pull a Benchmark Band (Not a Single Number)
In your lane tool (or in Freight Data Watch lane comps), record:
- Low / Median / High (or p25 / median / p75)
- Sample size (if shown)
- Last updated timestamp
Here is what a lane rate band looks like over time — three lines (p25/median/p75) show whether the market is expanding or contracting:
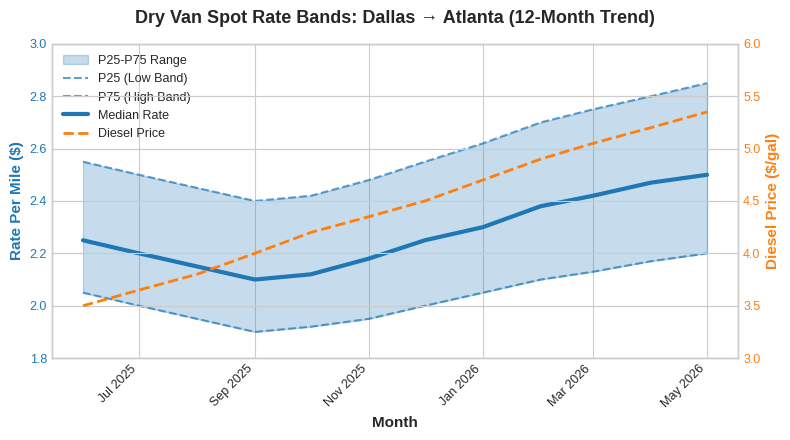
Notice how the median (bold blue line) climbed steadily from $2.10 in October 2025 to $2.50 by May 2026, while diesel (orange dashed line, right axis) spiked from $3.50 to $5.35. If you only looked at all-in rates, you would think the market moved more dramatically than it actually did.
Insight: If the median is flat but the high band (p75) is rising, it often means the lane is getting "spiky" — tight capacity at specific times — not broadly expensive. That distinction matters for how you negotiate.
Step 4: Add Market Context (Capacity + Diesel)
Two lanes with the same median RPM can have totally different "should I take it?" answers depending on market conditions.
Capacity signal:The Capacity Tightness Index currently sits at 76/100 — Extremely Tight. The national load-to-truck ratio is at 7.8 loads per truck, well above the long-run balance point of roughly 3.0. When capacity tightens like this, the market supports higher rates — especially near weekends and holidays.
Diesel context:National diesel is at $5.35/gal with fuel surcharges averaging $2.11/mi. If diesel jumped 10% but your linehaul benchmark did not move, the all-in rate will look inflated even though carriers are not earning more on a net basis.
Here is how capacity and rates have moved together over the past 12 months:
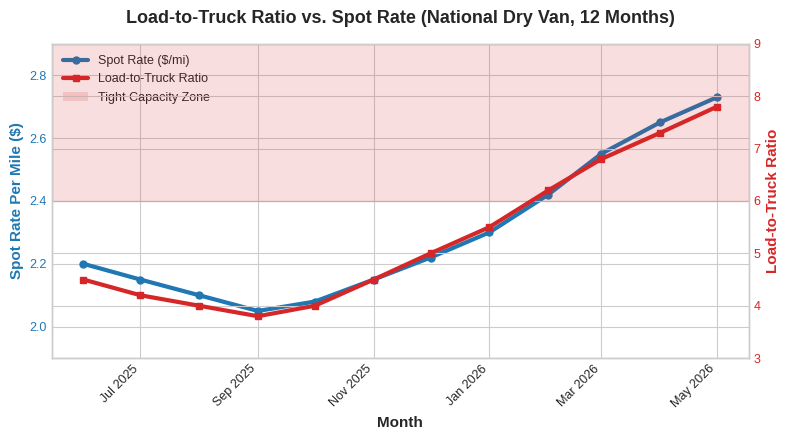
The shaded zone shows when the load-to-truck ratio crossed above 6.0 — the point where carriers gain meaningful pricing leverage. Notice how spot rates followed capacity tightening with roughly a 2-4 week lag.
Step 5: Convert a Quote Into a Benchmark Decision
When you get a quote, compute:
Quoted RPM (linehaul) = Linehaul amount / Loaded milesThen compare to your benchmark band:
- Below p25: Likely a weak offer (or there is hidden friction — short notice, bad facility, detention risk)
- Around median: Market rate — reasonable for both parties
- Above p75: Strong rate — verify constraints and payment terms before committing
Now add a friction adjustment:
- -$0.10 to -$0.40 RPM for known dwell, appointment pain, or slow-pay brokers
- +$0.05 to +$0.20 RPM for clean drop/hook with great terms and quick pay
Keep your adjustments consistent load-to-load.
Here is what this looks like visually — your quote RPM compared to the benchmark band:
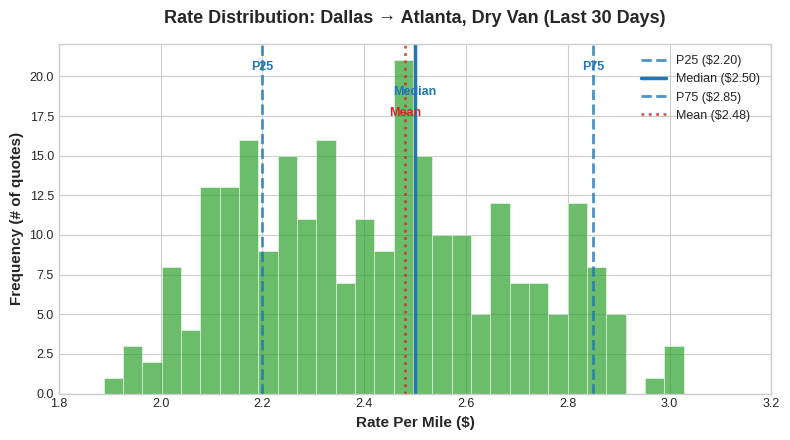
This distribution chart shows that rates on this lane ranged from roughly $1.90 to $3.10 over the last 30 days, with the median at $2.50 and the mean at $2.48. Notice the slight right skew — a few high-rate loads pull the average up while most activity clusters around the median. This is exactly why you want to benchmark against the median, not the average. Use the Profit Calculator to run the numbers on whether a specific quote actually works for your operating costs.
A Practical Spreadsheet Template (Copy This)
Create these columns in your rate tracking spreadsheet:
| Column | What to Enter |
|---|---|
| Date | Load date |
| Origin | City/state or ZIP3 |
| Destination | City/state or ZIP3 |
| Equipment | DV / Reefer / Flatbed |
| Miles | Loaded miles |
| Quote Linehaul ($) | Linehaul amount offered |
| Fuel Surcharge ($) | FSC amount |
| All-In ($) | Total quoted amount |
| RPM Linehaul | = Linehaul / Miles |
| RPM All-In | = All-In / Miles |
| Benchmark P25 | From your benchmark source |
| Benchmark Median | From your benchmark source |
| Benchmark P75 | From your benchmark source |
| Capacity (LTR) | Load-to-truck ratio |
| Diesel | Weekly national avg |
| Notes | Appointments, dwell, broker, deadhead |
- RPM Linehaul = Linehaul / Miles
- RPM All-In = All-In / Miles
- Position vs Median = RPM Linehaul - Benchmark Median
- Margin Indicator: If Position vs Median > 0, the load is above market
How to Compare DAT vs Truckstop-Style Comps Without Over-Trusting Either
People search "DAT Truckstop lane rates" because they want a definitive answer. The truth: each source is a model of the market, not the market itself.
DAT and Truckstop.com both aggregate rate data, but they can differ due to:- Different data sources and panel compositions
- Different sampling and normalization methods
- Different time windows and update frequencies
- How they handle accessorials and fuel surcharges
What to Do Instead: Two-Source Sanity Check
- Pull your lane's band from your preferred benchmark source (or Freight Data Watch)
- Confirm the market direction with a second signal:
- Diesel: Did fuel prices move significantly?
- Your own history: What did you actually book on this lane last week?
If one source says rates are up but capacity is loosening and diesel is flat, treat it as "uncertain" and negotiate for flexibility or shorter commitment.
Negotiation Scripts You Can Use (Copy/Paste)
When the quote is below your p25:
"I am seeing this lane trading closer to $X.XX RPM recently. At $Y.YY RPM it is below the current market band. If we can get to $Z.ZZ RPM, I can commit today."When the quote is near median but constraints are heavy:
"At that rate we would need either flexible pickup, reduced appointment risk, or accessorial coverage for detention. If we keep the constraints, we would need $X.XX RPM."When the quote is above p75 (verify and close):
"That works. Confirming: drop/hook vs live, appointment details, detention terms, and quick-pay options?"The key is using real data to anchor your negotiation — not guesswork. Pull the numbers from Freight Data Watch before you pick up the phone.
Real Examples: What "Good" Looks Like
Lane A: Dallas to Atlanta (Dry Van)
Situation: Median RPM flat at $2.50, but diesel up $0.80/gal over 3 months. What happened: All-in rates looked like they jumped 15%, which spooked the shipper into thinking carriers were "price gouging." In reality, linehaul rates had barely moved — it was almost entirely fuel surcharge. The carrier who showed the shipper the linehaul breakdown (using Fuel Price Index data) kept the contract.Lane B: Chicago to Dallas (Reefer)
Situation: Load-to-truck ratio spiked from 8.0 to 17.3 during spring produce season. What happened: P75 rates jumped from $3.00 to $3.45/mi while the median only moved from $2.90 to $3.10. Smart carriers who tracked the Capacity Tightness Index saw the tightening early and held out for p75+ rates instead of accepting the first offer at median.Lane C: Nashville to Savannah (Dry Van)
Situation: A broker offered $2.60/mi — above median. Looks great on paper. What happened: The facility had a 4-hour average dwell time and no detention pay. After adjusting for 4 hours of lost driving time (~$0.35/mi equivalent), the effective rate dropped to $2.25/mi — actually below p25. The carrier who checked the Lane Opportunities scoring (which factors in execution difficulty) passed on this load and found a cleaner option.Common Mistakes That Cost Carriers Money
- Comparing reefer to dry van — or mixing equipment types in your benchmark data
- Mixing all-in and linehaul benchmarks — making fuel surcharges look like rate changes
- Ignoring capacity context — taking "median" as gospel when the market just shifted
- Using a 30-day average when the market moved significantly last week
- Not tracking your own accepted rates — your personal history is a benchmark too
- Relying on a single data source — use at least two signals before making a decision
Frequently Asked Questions
What is a freight rate benchmark?
A freight rate benchmark is a reference rate — ideally a range like p25/median/p75 — used to evaluate whether a quoted lane rate is below, within, or above the current market. Rather than using a single average number, benchmarking with a band gives you a more accurate picture of where a quote falls relative to real market activity.
How do I benchmark freight lane rates per mile?
Normalize the quote to RPM (rate per mile) by dividing linehaul by loaded miles. Match the same lane definition and equipment type precisely, and compare the quote RPM to a recent benchmark band (p25/median/p75) for that lane using a tool like Freight Data Watch.
Why do DAT and Truckstop lane rates differ?
They can differ due to data sources, sampling, timing windows, and how rates are normalized. Use them as signals, then validate with capacity and diesel context rather than taking either one as the single source of truth.
Should I use linehaul or all-in for comparisons?
Linehaul is often cleaner for benchmarking because fuel surcharges fluctuate with diesel. Track both when possible — but always compare apples-to-apples. Never mix all-in from one source with linehaul from another.
How often should I update my benchmarks?
Weekly is a good default. In volatile markets (like the current tightening cycle), check 2-3 times per week for your core lanes. The Market Overview page gives you a quick snapshot any time.
What if I only have a few data points?
Use a wider time window (14-30 days), rely more on market direction signals (capacity and diesel), and track your own accepted loads to build a personal benchmark history.
Is there a free tool to benchmark freight rates?
Yes. Freight Data Watch provides free real-time rate data, lane analytics, capacity metrics, and diesel tracking. You can benchmark rates across lanes without any subscription or credit card.
Next Steps
If you want to start benchmarking your rates today:
- Open Freight Rates & Capacity and pull benchmark bands for your top 5 lanes
- Check the Market Overview for this week's direction
- Track Diesel and Capacity Tightness before your next negotiation
- Save this post and use the spreadsheet template as your weekly checklist
If you are building a weekly rate routine, the data is there — and it is free. The question is whether you will use it.
Related reading: Load-to-Truck Ratio Explained | Most Profitable Trucking Lanes in 2026 | Free vs Paid Freight Intelligence | Freight Glossary