
What Is Freight Data? (The 30-Second Answer)
Freight data is information about trucking rates, capacity, fuel costs, and market trends that carriers, brokers, and shippers use to make better decisions.
If you have ever wondered whether a load is paying fairly, whether rates are going up or down, or where to position your truck next week — you were looking for freight data. The difference between guessing and knowing is the difference between leaving money on the table and running a profitable operation.
Here is what freight data helps you do:- Understand what loads should actually pay on a given lane
- Identify which lanes are strong and which ones to avoid
- Predict where rates are headed before the market moves
- Negotiate from a position of knowledge, not hope
The bottom line: Carriers who use freight data consistently outperform those who rely on broker quotes and gut instinct. The data exists — for free. The question is whether you are using it.
TL;DR: The 5 Freight Metrics That Actually Matter
If you only track a few things, track these five. They cover 90% of the decisions a carrier needs to make:
- Freight Rates Per Mile (RPM) — what loads are paying right now
- Load-to-Truck Ratio — supply vs demand (the leading indicator)
- Diesel Prices — your biggest variable cost
- Lane-Specific Rates — not all lanes are created equal
- Market Trends Over Time — direction matters more than any single number
- Market Overview — all metrics at a glance
- Freight Rates & Capacity — lane-level rate data
- Load-to-Truck Ratio — capacity signal
- Fuel Price Index — diesel tracking
- Capacity Tightness Index — market pressure gauge
Here is what all five metrics look like right now, at a glance:
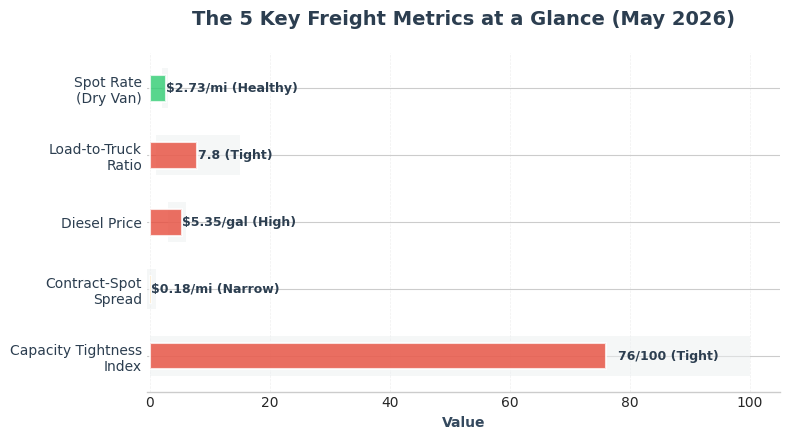
Notice the pattern: the load-to-truck ratio (7.8) and capacity tightness index (76/100) are both flashing "tight," which means carriers currently have pricing leverage. Spot rates at $2.73/mi confirm this — they have climbed steadily as capacity tightened. Meanwhile, diesel at $5.35/gal is elevated, which makes separating linehaul from fuel surcharge essential when evaluating loads.
Why Freight Data Matters (And What Happens Without It)
Carriers who use freight data:
- Negotiate better rates because they know what the lane is actually paying
- Avoid weak markets by reading capacity signals before committing
- Stay profitable during downturns by adjusting lanes and timing
- Build a repeatable process that works regardless of market conditions
Carriers who do not use freight data:
- Accept the first broker quote without context
- Rely on outdated assumptions about which lanes pay well
- Get caught off-guard when markets shift
- Leave thousands of dollars per month on the table
Insight: Freight data turns every load decision into a calculated move instead of a gamble. The carriers who survived the 2024-2025 downturn were the ones who saw the capacity loosening in data before they felt it in their revenue.
Metric #1: Freight Rates Per Mile (RPM)
What it is
Freight rates per mile — or RPM — is the most fundamental freight metric. It measures how much you earn for every loaded mile driven.
The formula is simple:RPM = Total Rate / Loaded Miles
For example: a $2,400 load over 900 miles = $2.67 RPM.
What to watch for
- Spot rates fluctuate daily based on supply and demand. The national average for dry van is currently around $2.73/mi.
- Contract rates are more stable, currently averaging $2.91/mi for dry van — an $0.18 premium over spot.
- The spread between contract and spot tells you how tight the market is. A narrow spread (like now) means spot rates are catching up to contract — a sign of a tightening market.
How to act on it
Do not just check the national average. Check the rate for your specific lane — national averages hide enormous lane-to-lane variation. A $2.73 national average might mean $3.10 on one lane and $2.30 on another.
Check your lane rates on the Freight Rates & Capacity page. Compare your quoted rate to the lane median, not the average — medians are more resistant to outliers and give you a truer picture of what loads actually pay.
Metric #2: Load-to-Truck Ratio (The Leading Indicator)
What it is
The load-to-truck ratio measures how many available loads exist for every available truck in a given market. It is the single best leading indicator of where freight rates are headed.
- High ratio (above 6.0): More loads than trucks — capacity is tight, carriers have leverage, rates go up
- Balanced (3.0-6.0): Supply and demand roughly in equilibrium
- Low ratio (below 3.0): More trucks than loads — capacity is loose, rates soften
Current reading
The national load-to-truck ratio is currently at 7.8 — well into "tight" territory. By equipment type:
- Dry Van: 9.6 loads per truck
- Reefer: 17.3 loads per truck (produce season effect)
- Flatbed: 21.1 loads per truck
How to act on it
When the ratio is above 6.0, do not accept the first offer. You have leverage. Check the Capacity Tightness Index — currently at 76/100 (Extremely Tight) — and use that context to hold out for rates closer to the 75th percentile on your lane.
When the ratio drops below 3.0, shift strategy: focus on your most efficient lanes, reduce deadhead, and lock in contract freight for stability.
Insight: The load-to-truck ratio typically moves 2-4 weeks ahead of rate changes. If you see the ratio climbing while rates are still flat, rates are about to follow. This is the closest thing to a crystal ball in trucking.
Track it in real time on the Load-to-Truck Ratio page. For a deeper dive into how to read and act on this metric, see our full guide: Load-to-Truck Ratio Explained.
Metric #3: Diesel Prices
What it is
Diesel is the largest variable cost for most carriers, and it directly impacts both your operating costs and the freight rates you see quoted.
Current reading
National diesel is at $5.35/gal with an average fuel surcharge of $2.11/mi. Diesel has climbed from roughly $3.50/gal a year ago — a 53% increase that has significantly impacted carrier operating margins.
Why it matters more than you think
Diesel does not just affect your fuel bill. It affects how you should read freight rates:
- All-in rates include fuel surcharge and can make it look like rates jumped 15% when linehaul barely moved
- Linehaul rates strip out fuel and give you a cleaner picture of true market conditions
- When diesel moves fast, always separate linehaul from fuel surcharge in your analysis
How to act on it
Track diesel weekly on the Fuel Price Index. When diesel spikes:
- Re-calculate your cost per mile using the Profit Calculator
- Compare linehaul RPM (not all-in) against your benchmark to see if the actual rate moved
- Push back on brokers who claim "rates are up" when it is only the fuel surcharge component
Insight: A $0.50/gal diesel swing can move all-in RPM by $0.07-$0.10/mi without any change in actual linehaul rates. Carriers who do not separate these two numbers regularly undervalue or overvalue loads.
Metric #4: Lane-Specific Rates
What it is
Lane rates are the freight rates for specific origin-to-destination routes. Unlike national averages, lane rates tell you what your actual corridors are paying.
Why national averages mislead
The "national average spot rate" is a composite of thousands of lanes. Some are booming, some are depressed. Using the national average to evaluate a specific load is like using the national average temperature to decide what to wear in Miami.
Lane rates vary based on:
- Geography — outbound rates from high-freight-volume origins (like Dallas or Atlanta) differ vastly from low-volume markets
- Season — produce season in spring pushes reefer rates on specific corridors 20-30% above their winter levels
- Direction — headhaul lanes (primary direction) almost always pay more than backhaul lanes
- Equipment — reefer and flatbed lanes command premiums over dry van
How to act on it
Build a "Top 5 Lanes" watchlist and check them weekly:
- Open Freight Rates & Capacity
- Pull the p25 / median / p75 band for each lane
- Track the trend — is the median rising, falling, or flat?
- Cross-reference with the Lane Opportunities score to see which lanes are rated highest for profitability and execution difficulty
If a lane's median is falling while the national average is rising, that lane is weakening even in a strong market. Shift your focus to lanes where the data confirms strength.
Metric #5: Market Trends Over Time
What it is
Market trends show the direction that rates, capacity, and demand are moving. A single data point tells you where you are. A trend tells you where you are going.
Why trends matter more than snapshots
A rate of $2.73/mi means something very different depending on context:
- If it was $2.50 last month and $2.30 two months ago → the market is accelerating upward (bullish for carriers)
- If it was $3.00 last month and $3.20 two months ago → the market is declining (time to adjust)
How metrics move together
Here is what the last 12 months looked like when you overlay spot rates, the load-to-truck ratio, and diesel — all normalized to the same starting index:
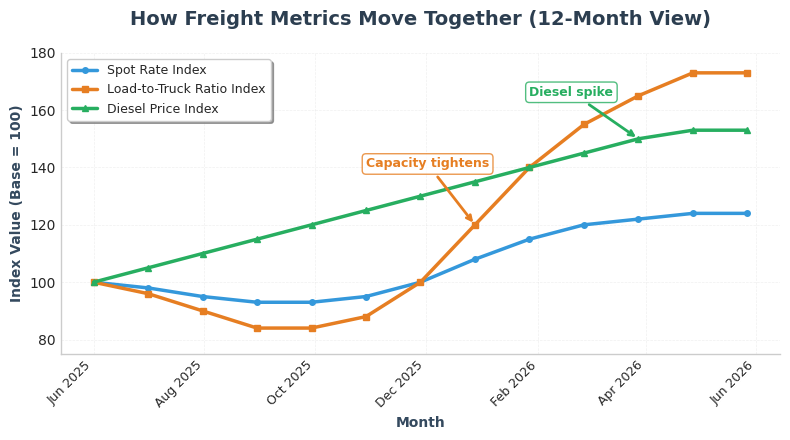
The key insight from this chart: the load-to-truck ratio (orange line) led the rate recovery by roughly 2-4 weeks. When capacity started tightening in late 2025, rates did not respond immediately — but they followed. Carriers who watched the capacity signal positioned themselves early and captured the rate recovery before it was obvious to everyone.
Diesel (green line) climbed steadily throughout the period, adding $0.08-$0.12/mi to all-in rates independent of actual market rate changes.
How to act on it
Check the Market Overview weekly for direction. Specifically:
- Is the load-to-truck ratio rising or falling? This tells you where rates are headed in the next 2-4 weeks.
- Is diesel trending up or down? This tells you how to interpret all-in rate changes.
- Are your top lane medians moving with the national trend or against it? Divergence is a signal to rebalance your lane mix.
How to Use Freight Data in a Real Decision (Step-by-Step)
Here is the exact process to follow before booking any load:
Before accepting a load:
- Check the lane rate — What is the p25 / median / p75 for this lane on Freight Rates & Capacity?
- Compare the quote to the median — Is the offer below, at, or above the current market?
- Check the load-to-truck ratio — Is capacity tight or loose? This tells you whether to push back or accept.
- Check diesel — Did fuel prices move recently? Separate linehaul from all-in.
- Confirm market direction — Is the overall trend up, down, or flat on the Market Overview?
Then decide:
- Accept — if the rate is at or above median and market direction supports it
- Negotiate — if the rate is below median but capacity is tight (you have leverage)
- Pass — if the rate is below p25 and the lane has better options available
Example: Putting It All Together
Load offer: $1,800 for 900 miles = $2.00 RPM What the data says:- Lane median: $2.20 RPM → the offer is $0.20 below market
- Load-to-truck ratio: 7.8 → capacity is tight (carrier leverage)
- Diesel: stable week-over-week → no fuel-driven distortion
- Trend: rates rising on this lane over the last 4 weeks
Insight: Even a $0.20 RPM improvement on a 900-mile load is $180 more per load. Over 4 loads per week, that is $720/week or $37,000 per year in additional revenue — just from knowing the data before picking up the phone.
Freight Data Analytics: You Do Not Need Enterprise Software
"Freight data analytics" sounds like something that requires a six-figure platform and a team of analysts. It does not.
What freight data analytics actually means for a working carrier:- Tracking your core lane rates over time (weekly)
- Watching the load-to-truck ratio and capacity signals
- Monitoring diesel and separating it from linehaul trends
- Using that combined picture to decide where to run, what to accept, and when to negotiate
You do not need complex software. You need reliable data, consistency, and a repeatable process.
That is exactly what Freight Data Watch provides — for free. No subscription. No credit card. No sales demo. Just the data that matters.
If you want to build a simple weekly routine:
- Every Monday: check the Market Overview for the week's direction
- Every Monday: pull fresh rate bands for your top 5 lanes from Freight Rates & Capacity
- Every Monday: note diesel and the Capacity Tightness Index
- Before each load: compare the quote to your lane benchmark (takes 60 seconds)
That is freight data analytics. No PhD required.
Common Mistakes Carriers Make with Freight Data
- Using national averages to evaluate specific lanes — always use lane-specific data
- Mixing all-in and linehaul rates — diesel distorts all-in comparisons
- Checking data reactively instead of proactively — build a weekly routine
- Ignoring capacity signals — the load-to-truck ratio is your best early warning system
- Not tracking their own history — your accepted rates over time are a personal benchmark that no external tool can replace
Frequently Asked Questions
What is freight data used for?
Freight data is used to evaluate whether load rates are fair, understand current market conditions, identify strong and weak lanes, and make data-driven decisions about which loads to accept, negotiate, or pass on. It replaces guesswork with real market context.
What is a good freight rate per mile?
A "good" rate depends entirely on the lane, equipment type, fuel costs, and current market conditions. The national average for spot dry van is currently around $2.73/mi, but your specific lane could be significantly higher or lower. Always compare against the current median for that lane rather than a national number.
What is the load-to-truck ratio and why does it matter?
The load-to-truck ratio measures supply vs demand in the freight market. A high ratio (above 6.0) means more loads than trucks — tight capacity where carriers have pricing leverage. A low ratio (below 3.0) means more trucks than loads — loose capacity where rates soften. It is the single best leading indicator of rate direction. Check it on the Capacity page.
How often should carriers check freight data?
Carriers should check freight data at least several times per week. Building a Monday morning routine to review market conditions, lane rates, diesel, and capacity takes about 10 minutes and pays for itself many times over. In volatile markets, daily checks on your core lanes are recommended.
What affects freight rates the most?
The three biggest factors are capacity (load-to-truck ratio), diesel prices, and seasonal demand. When capacity tightens and diesel rises simultaneously, rates can move up rapidly. The load-to-truck ratio typically leads rate changes by 2-4 weeks, making it the most valuable predictive signal.
How is freight data analytics different from just checking rates?
Checking rates gives you a snapshot. Freight data analytics means tracking rates over time, comparing across lanes, overlaying capacity and diesel context, and using that combined picture to make forward-looking decisions. It turns reactive rate-checking into proactive business strategy — and you can do it in 10 minutes per week.
Is there a free freight data analytics platform?
Yes. Freight Data Watch provides free real-time freight rates, lane analytics, capacity metrics, diesel tracking, and market trend data. No subscription, no credit card, and no trial period. It was built by truckers for truckers.
The Bottom Line
If you track these 5 metrics consistently — rates, capacity, diesel, lane performance, and trends — you will:
- Make better load decisions based on data instead of gut feel
- Avoid unprofitable loads by benchmarking every quote against the market
- Capture more revenue by negotiating with real numbers
- Stay ahead of market shifts by watching leading indicators
Freight data is not optional anymore. It is your competitive edge. And with Freight Data Watch, it is completely free.
Start with the Market Overview. Check your top lanes. Build the habit. The data is there — the question is whether you will use it.
Related reading: Load-to-Truck Ratio Explained | How to Benchmark Your Freight Lane Rates | Most Profitable Trucking Lanes in 2026 | FreightWaves SONAR Alternative | Freight Glossary